Introduction
With the lengthy policy of quantitative easing of the ECB, it is no surprise that interest rates have become unprecedentedly low, even trending to become negative. These macroeconomic conditions are very favorable for investments and the world economy is booming. But is this sustainable? Does it not resemble the situation in the pre-crisis of 2007-2009? With such an excessive lending how vulnerable are financial institutions in case of stagnation and an interest rate rise? What would the consequences be?
With all of that in mind, the Basel committee (primary global standard setter for regulation and supervision of banks) has issued a new standard, implemented as of 2018. It demands that banks use standardized methods to measure their exposure to interest rate risk, instead of bank-developed methods, which was the case before. Standardized methods are always good from a simplicity and comparability point of view, but are they actually accurate enough to capture the risk at stake? Or do we trade off quality of measurements for simplicity with this new implementation?
То investigate this question, we looked at the methodology of proper risk management under the guidance of Prof. Dr. M. Folpmers, and compared the outcomes with the newly proposed standardized version.
Background
To start, it is crucial to get a good understanding on how banks operate. A bank’s balance sheet includes both their assets, liabilities and equities. Many components on this balance sheet are financial instruments. These are priced on the balance sheet at their present value (discounted against the interest rate over time). Because of this, the value of these items on the balance sheet, and the balance sheet as a whole, are heavily dependent on the interest rates. Hence, banks are exposed to a certain level of interest rate risk. Banks use tools like duration and PV01 to calculate this risk exposure, either for the whole portfolio, or per maturity bucket (set of cash flows/ instruments with similar maturities). Duration calculates both the weighted average time until return of the cash flows and the percentage change in value of this cash flow if the interest rate would change by 1 percentage point. PV01 does a similar calculation, however per maturity bucket, following a change of 1bp (which is 0.01 percentage point).
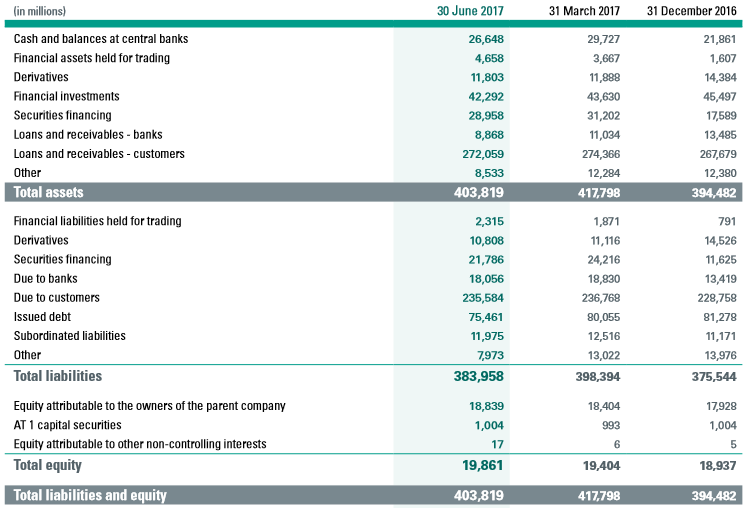
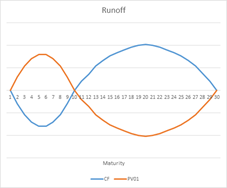
The bank’s asset side contains, for a large part, loans they provided, like retail mortgages, which are rather long term. In the contrary, their liability side contains loans they received, like from consumer savings, which are more in the short term (see figure 1). As the accounting equation dictates; equity = assets – liabilities. For banks this implies that the value of equity depends on the combination of long term interest rates, over their assets, and short-term interest rates, over their liabilities. Similarly, their profits depend on receiving, in general, higher rates over the long term, while paying generally shorter rates in the short term.
Interest rate risk in the banking book (IRRBB) consists out of two parts; interest rate risk: the risk incorporated within interest rate/yield shifts, and in the banking book: applied to banks, the financial corporations who work specifically with loans and interest, that is their business model.
Interest rate risk can be decomposed into two main approaches. The first approach is the earnings at risk approach: The risk the bank has on its earnings because of changing interest rates. The second approach is the value approach: because of specific interest rate shock and stress scenarios, economic value measures make a change in the net present value of the bank’s assets and liabilities. This approach can be decomposed into two questions: 1. Is the interest rate sensitive to risk? 2. If this is true, how large are these swings in the interest rate?
Field evidence
Building upon the above explained fundamentals, we continued with field evidence in the form of interviews with both Mr. Versendaal, who is ALM manager at ABN AMRO, as well as Mr. Baalhuis, who is the senior pricing analyst at de Volksbank. This to ask them about their insights on Basel standard #368. Firstly, we asked them which IRRBB approach they used more; earnings-based approach or value-based approach? They both stated that they use both approaches, yet the value-based approach is used on the long-term, whereas the earnings-based approach is used on the shorter term up until three years. Secondly, both J. Versendaal as well as J. Baalhuis mentioned that the instant shock of 200 bps, as stated in Basel standard #368, is realistic on a one-year horizon. However, it is unrealistic on a shorter term such as one day or as an instantaneous shock. Lastly, they both indicated that the six standard shock scenarios, which are introduced in the new Basel guideline, are good for comparability between banks, however are not representative for real-life scenarios.
Principal Component Analysis
In order to answer the problem definitions; whether Basel III captures the interest rate behavior well enough, one could apply the principal component analysis (PCA). This mathematical data analysis finds the underlying structure of the data, which are in this case the typical movements of the yield curve.
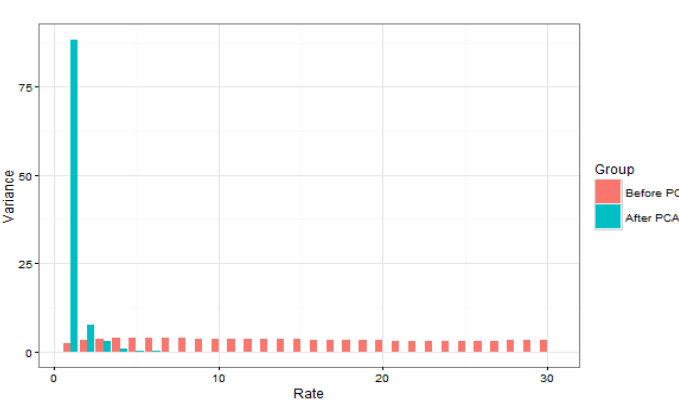
The data used is weekly US Treasury yield curves with maturities from 1 to 30 years from 1986 until 2017. As the yield curves for different maturities are heavily correlated, we find that 98% of the variation in interest rates can be explained using only 3 movement types (shocks). Since each movement can be either positive or negative, six basic scenarios are obtained. Basel III proposes exactly these six scenarios, capturing 98% of the interest rate variation over the last 31 years.
Next to that, plotting the three movements on a timeline gives the time period with which a 200 basis point shock would normally correspond. It turns out that a 200 basis point shock corresponds to a quarter of a year and an instantaneous 200 basis point shock is therefore unrealistic.
Data analysis
To test the appropriateness of the Basel standards even further, we carried out data analysis on historical interest rate movements. Our goal was to check whether the 200-basis point shock, proposed by Basel as the threshold interest rate change, is high enough, or whether more severe shocks are likely to occur.
We used data from Quandl for both monthly and yearly interest rate changes of maturities up to 30 years for the period between 13-01-1986 and 16-10-2017. For the monthly data, we find that a shock of about 75-85 basis points can be expected for every maturity basket. There is no evidence that a 200 bp shock is likely to occur on a monthly basis, so we can say that the Basel proposed shock captures and even overestimates the monthly risk. However, the results for the yearly interest rate change data are quite different. The worst possible scenario is a 397-basis point upward shock in the short run, significantly above the 200-basis point threshold. For the medium and the long run, the worst possible interest rate increase is also above 200 basis points. Assuming a normal distribution of the shocks, the possibility of having a short run shock higher than 200 bp is around 8% or so, which is a substantial amount.
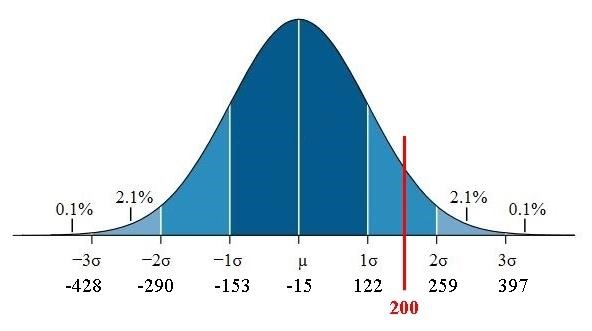
We conclude that the Basel proposed shock is quite safe to hedge against on a monthly basis. However, on a yearly basis it underestimates the size of the possible shock by quite a significant margin, so banks should not use it for their yearly hedging strategies.
Does Basel #368 provide sufficient coverage and guidance on IRRBB?
As said, interest rate risk can be broken down into two components; the interest rate sensitivity to risk, and the extent of the swings. The cash flows of a bank presented as a runoff give the most intuitive explanation (figure 5). As you can see, banks pay money in the short run, and receive money in the long run, as banks fund their liabilities with short term loans and the loans they provide are long term. It has been explained before that a change in interest rate affects the present values of both the liabilities and the assets. Moreover, assuming that banks make a profit, it becomes apparent that banks can be negatively affected by a change in interest rate. Due to the discounting, if rates go up, the present value of the assets is more heavily affected than the present value of the liabilities. So normally, banks lose value if interest rates go up.
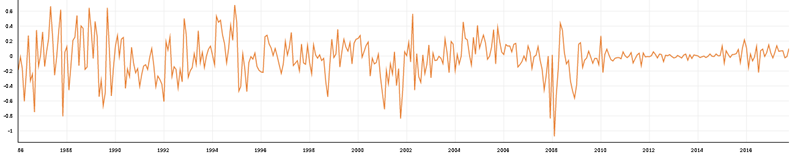
Now that we have identified our risk driver, we turn our attention to the volatility of this risk driver. In the picture below, you can see how the monthly interest rate has changed from 1986 until 2017 (figure 6).
Now that the risk exposure is apparent, we followed up with the PCA, which shows that 98.79 percent of the variation of the interest rate over the period 1986-2017 is caused by parallel shocks up and down, and changes to the slope and curvature of the yield curve. This corresponds with the shocks Basel proposes, and looking at the fact we derive from our data analysis on basis point shocks that instantaneous shocks of 200 basis points do not happen, this measure seems good at first glance, but as with a lot of things, the devil is in the details.
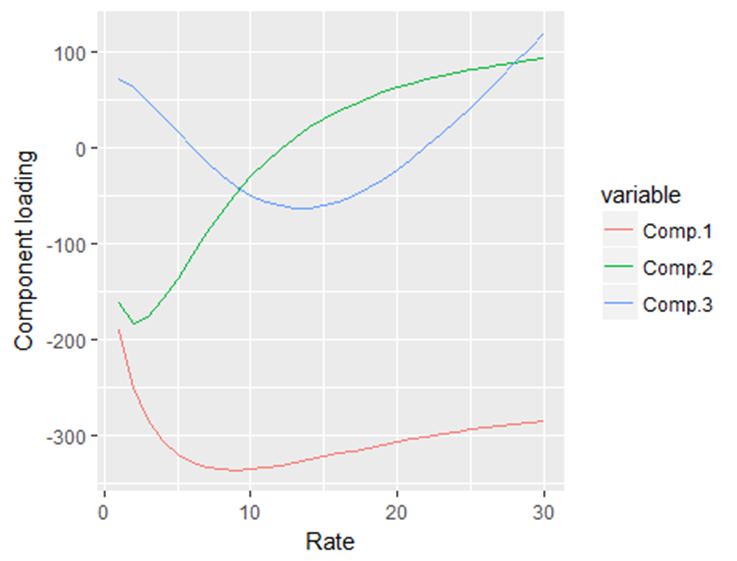
When looking at the graph of the first principal component (corresponds with a parallel shock up or down), you can see that for short-run maturities, the basis point shock has been bigger than for long-run maturities, concluding that it has not been a true proportionate shock as Basel prescribes. This disparity could lead to banks hedging improperly when they hedge against a true proportionate shock, revealing the standardized scenarios as not truly accurate measures.
From our historical analysis, we know that an instantaneous 200 basis point shock is something that is a statistical impossibility. However, you can imagine why it is not likely that banks hedge and change their entire portfolio every instant. Swaps can partially fix this problem, but banks are still bound by constraints, and as a result the instant basis point shocks may not be relevant to some banks, but the yearly basis point shocks are! Then, the 200 basis point shocks do not properly capture the risk to which a bank that hedges against yearly basis point shocks is exposed!
Following these findings, we can deduct that there is a clear trade-off between using the standardized scenarios or using more sophisticated, but more cumbersome ways to determine the interest rate risk a bank is exposed to.
On the one hand, the standardized scenarios are easy to implement, increase comparability across banks, and do not cost a lot of resources. However, there exist cases where these scenarios do not accurately capture all the bank’s interest rate risk, and that could lead to improper risk management. On the other hand, you have more sophisticated methods that do properly capture all risk, but are very expensive.
Taking into account that the goal of these scenarios is to compare banks on properly managing interest rate risk, we advocate for the use of standardized scenarios as they generally give a proper insight in how well risk is managed, while being cost-efficient.
References:
Basel Committee on Banking Supervision (2016, April 21). Standards Interest rate risk in the banking book. Retrieved October 11, 2017, from https://www.bis.org/bcbs/publ/d368.pdf
Versendaal, J. (2017, December 8). Interview at ABN AMRO [Personal interview].
Baalhuis, J. (2018, February 2). Interview at de Volksbank [Personal interview].
Martellini, L., Priaulet, P., & Priaulet, S. (2010). Fixed-income securities: valuation, risk management and portfolio strategies. Chichester: Wiley.
Shkens, J. (n.d.). A tutorial on principal component analysis, derivation, discussion and singular value decomposition. Retrieved February 13, 2018.
Interest Rates. (n.d.). Retrieved February 14, 2018, from https://www.treasury.gov/resource-center/data-chart-center/interest-rates/
Folpmers, M. (2017, Fall). Tilburg University Olab; Interest Rate Risk in the Banking Book. Lecture, Tilburg.